Watching the house breathe
The power bill tells you how much. It refuses to tell you what. We wanted the real answer, per circuit, live — so we instrumented the house.
The hardware problem: panels have a family tree
This house’s electrical layout is not a textbook diagram. Line power splits at the outside main into two feeds: one to the main house panel, one to an internal panel that in turn feeds an outdoor garage panel, which feeds an indoor garage subpanel. Panels feeding panels feeding panels.
We mapped the whole hierarchy before buying anything — every panel, every breaker, every amp rating, with photos of the actual boxes. That map lives as an Excalidraw diagram and became the single source of truth for everything downstream:
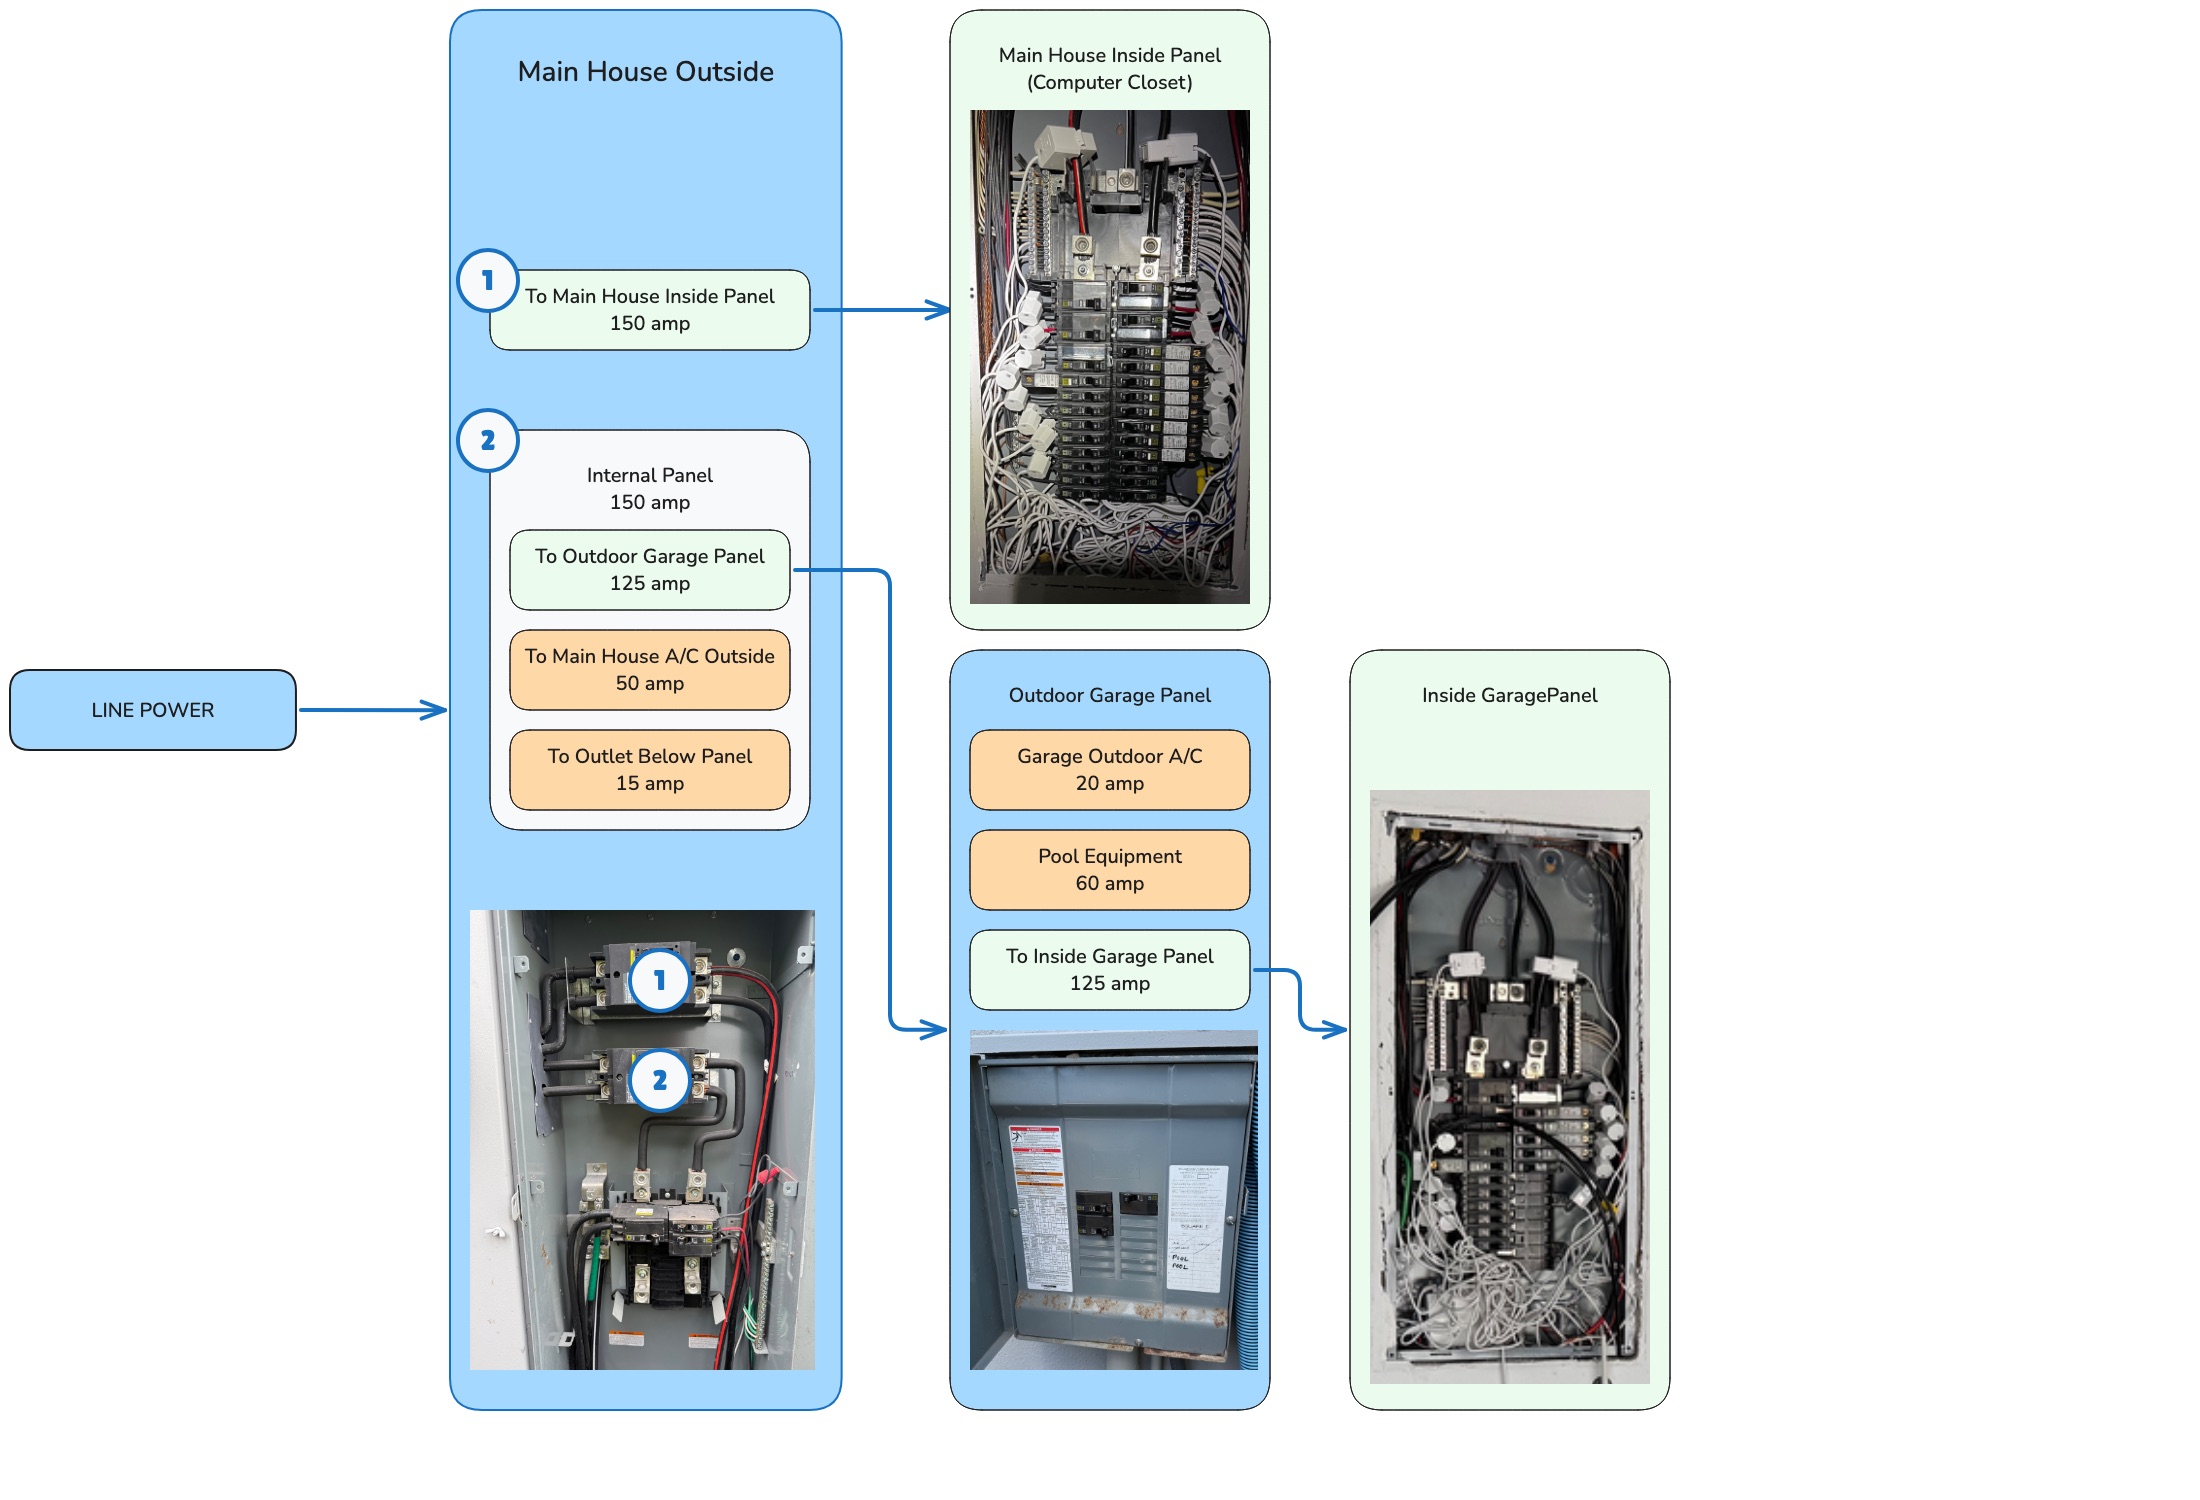
Then came the monitors: three Emporia Vue units — two with a full set of per-circuit current clamps (16 circuits each), and one on the middle panel reading its main feed. That third one, added in June, closed the last big blind spot in the map.
The software: poll, store, derive, animate
The stack is home-lab standard issue:
- A small program checks in with the monitors every five seconds, reads every circuit, and files the readings into a database built for exactly this — millions of tiny measurements over time.
- The same loop announces each reading on the house’s internal message bus, where our home-automation system picks up every circuit as a live sensor — so the house can react to power, not just record it.
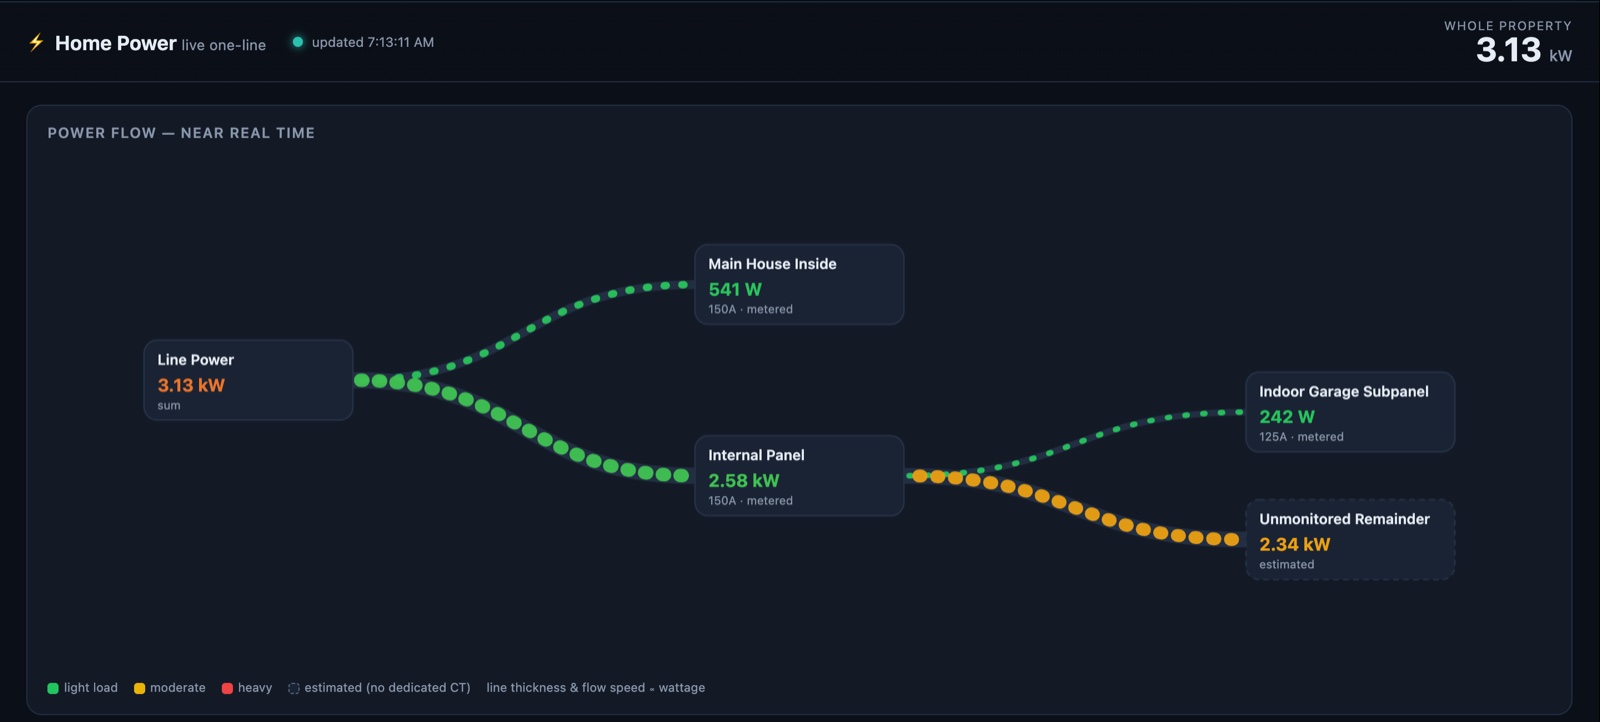
- And a small web app draws the payoff: an animated live diagram of the real panel layout above, watts flowing along the actual feed lines, with history charts behind it.
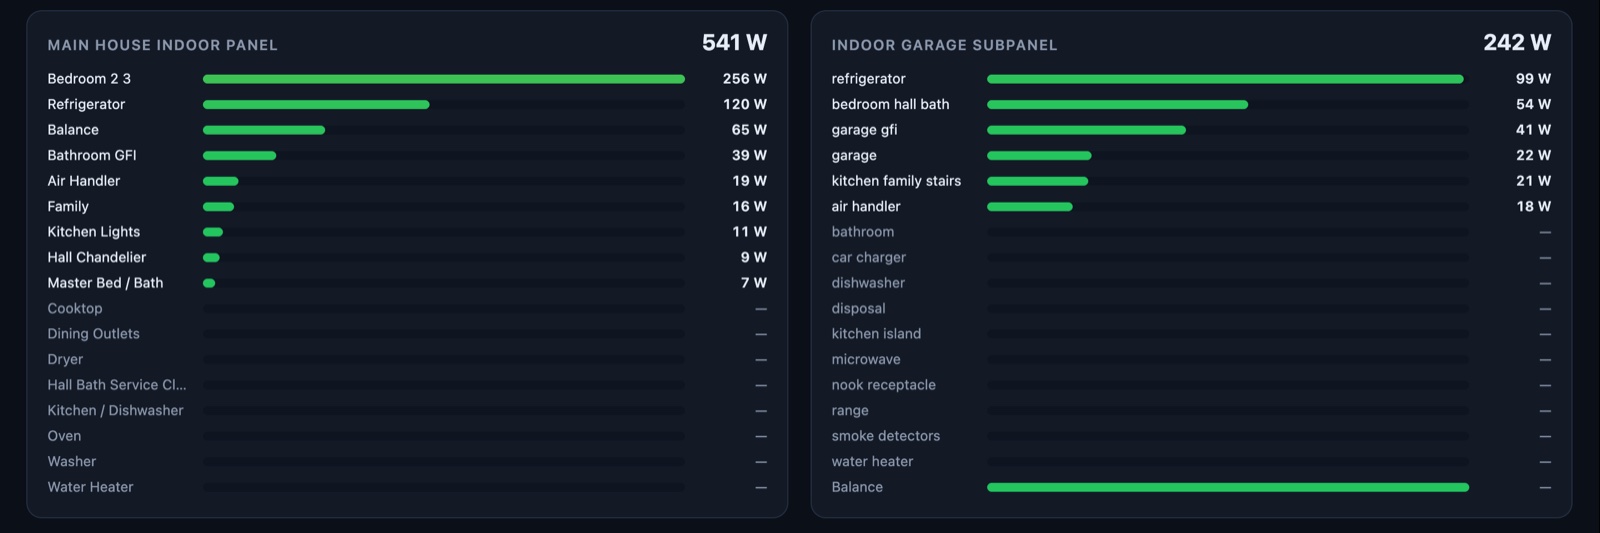
Below the diagram, every itemized circuit gets its own bar, refreshed every five seconds:
The subtle part is the arithmetic, and it all falls out of that family tree. Because the garage panel is fed through another panel, adding their readings together would count the same electricity twice. But subtracting them isolates the loads that don’t have their own sensors yet — the pool equipment, the big A/C units — as one calculated lump. The dashboard is honest about the difference between what’s measured and what’s inferred, and labels each.
What it’s told us so far
Once you can see per-circuit power at five-second resolution, the house stops being mysterious. The compressor short-cycling shows up as a comb pattern. The pool pump’s schedule is just there, arguing with the utility rate plan. Phantom load stops being a vibe and becomes a number with a circuit breaker attached to it.
What’s left
One or two more rounds of current clamps — the middle panel has sixteen empty channels waiting — and the inferred lump gets split into its real components. At that point every watt on the property is measured, named, and graphed. Then the fun part starts: letting Home Assistant act on it.